Trade
Basic
Futures
Futures
Hundreds of contracts settled in USDT or BTC
TradFi
Gold
Trade global traditional assets with USDT in one place
Options
Hot
Trade European-style vanilla options
Unified Account
Maximize your capital efficiency
Demo Trading
Futures Kickoff
Get prepared for your futures trading
Futures Events
Participate in events to win generous rewards
Demo Trading
Use virtual funds to experience risk-free trading
Earn
Launch
CandyDrop
Collect candies to earn airdrops
Launchpool
Quick staking, earn potential new tokens
HODLer Airdrop
Hold GT and get massive airdrops for free
Launchpad
Be early to the next big token project
Alpha Points
Trade on-chain assets and enjoy airdrop rewards!
Futures Points
Earn futures points and claim airdrop rewards
Investment
Simple Earn
Earn interests with idle tokens
Auto-Invest
Auto-invest on a regular basis
Dual Investment
Buy low and sell high to take profits from price fluctuations
Soft Staking
Earn rewards with flexible staking
Crypto Loan
0 Fees
Pledge one crypto to borrow another
Lending Center
One-stop lending hub
VIP Wealth Hub
Customized wealth management empowers your assets growth
Private Wealth Management
Customized asset management to grow your digital assets
Quant Fund
Top asset management team helps you profit without hassle
Staking
Stake cryptos to earn in PoS products
Smart Leverage
New
No forced liquidation before maturity, worry-free leveraged gains
GUSD Minting
Use USDT/USDC to mint GUSD for treasury-level yields
More
MaxFINEancial
No content yet
MaxFINEancial
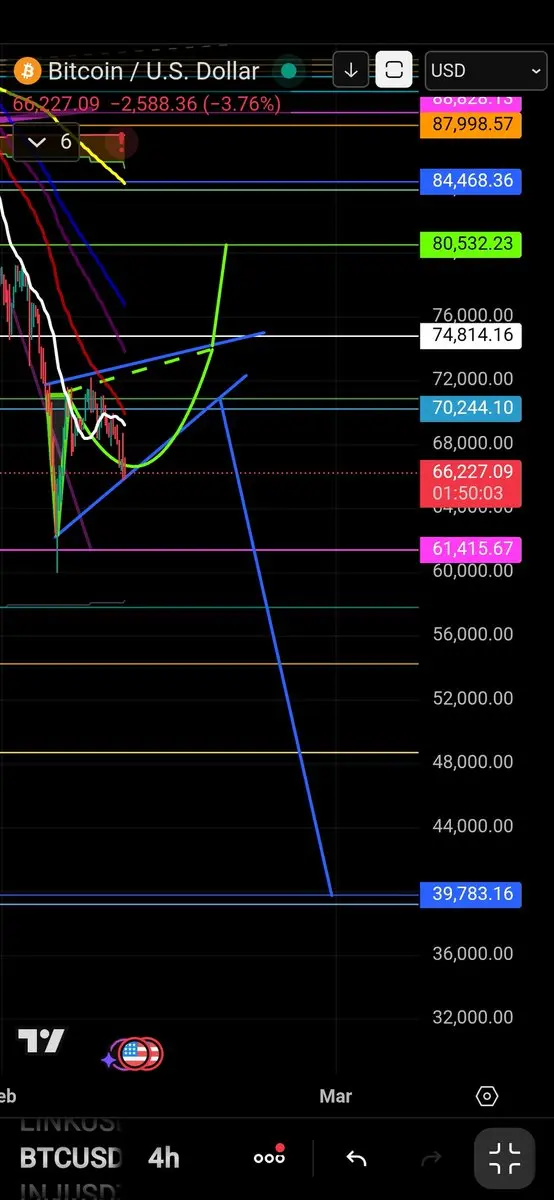
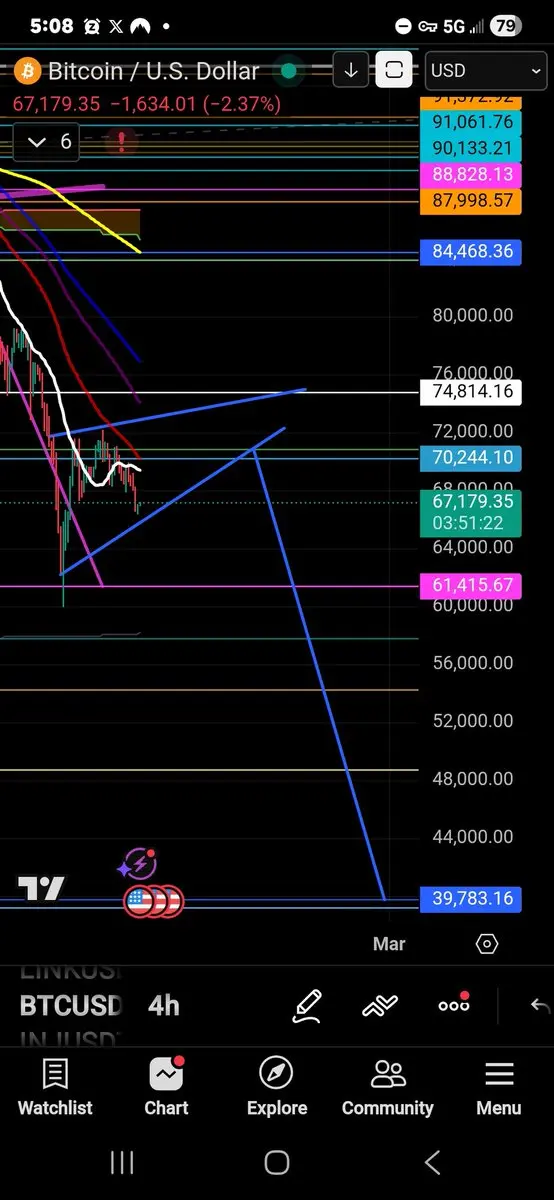
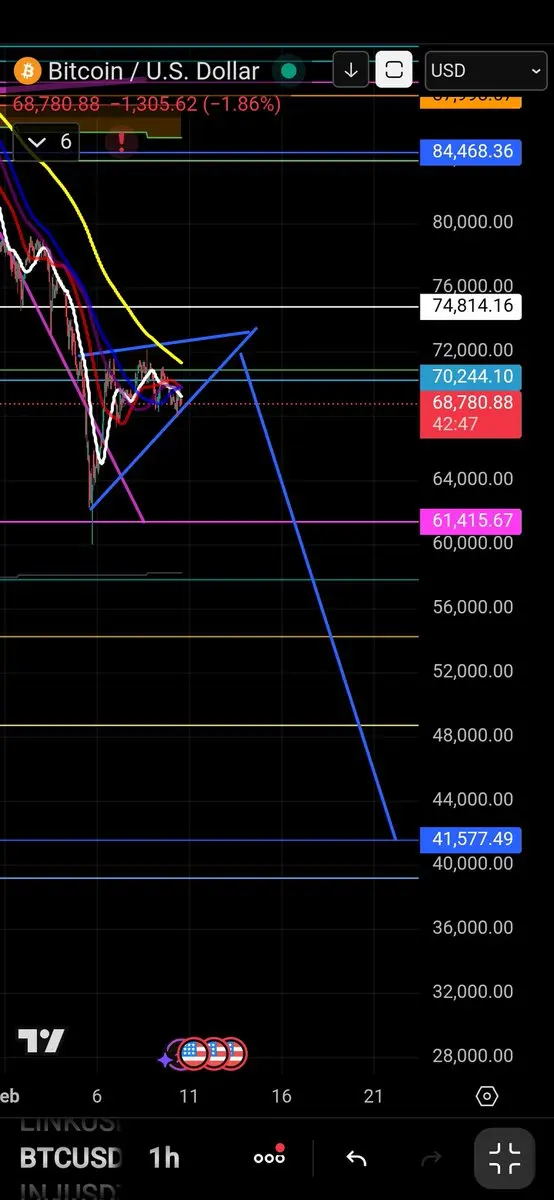
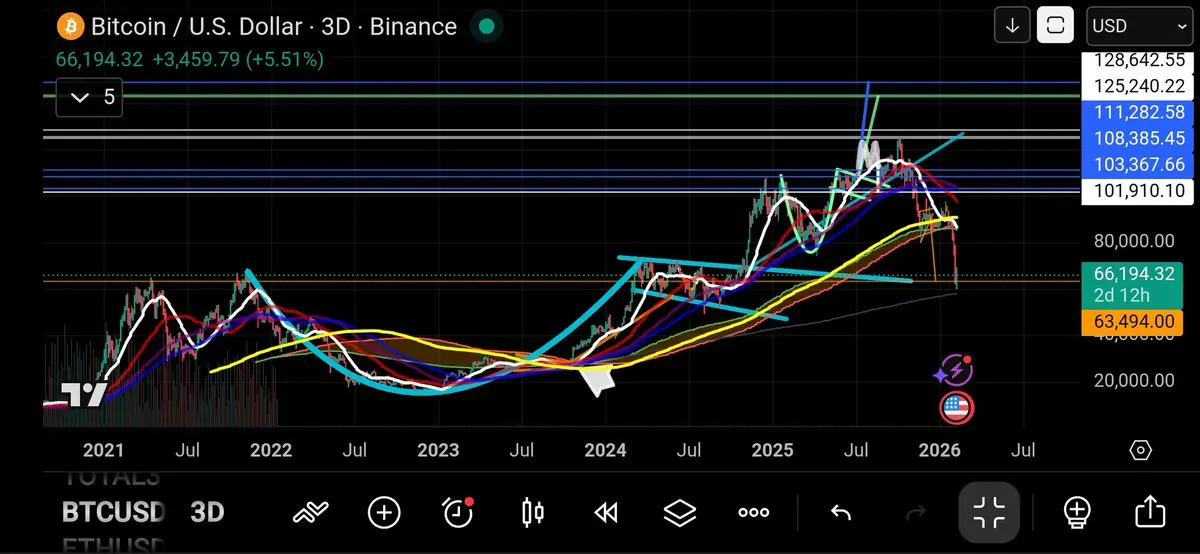
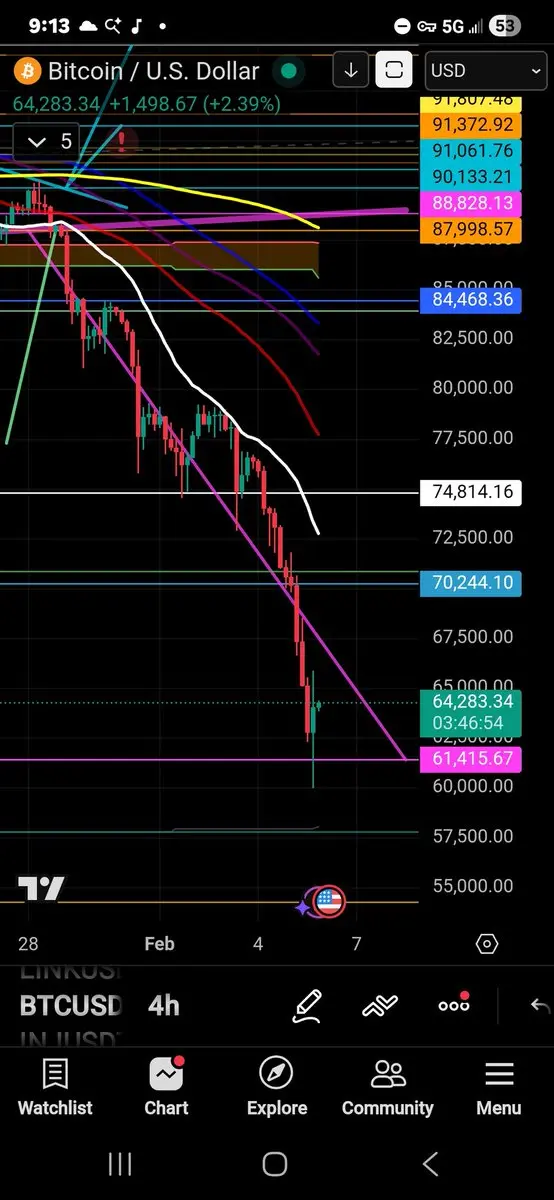
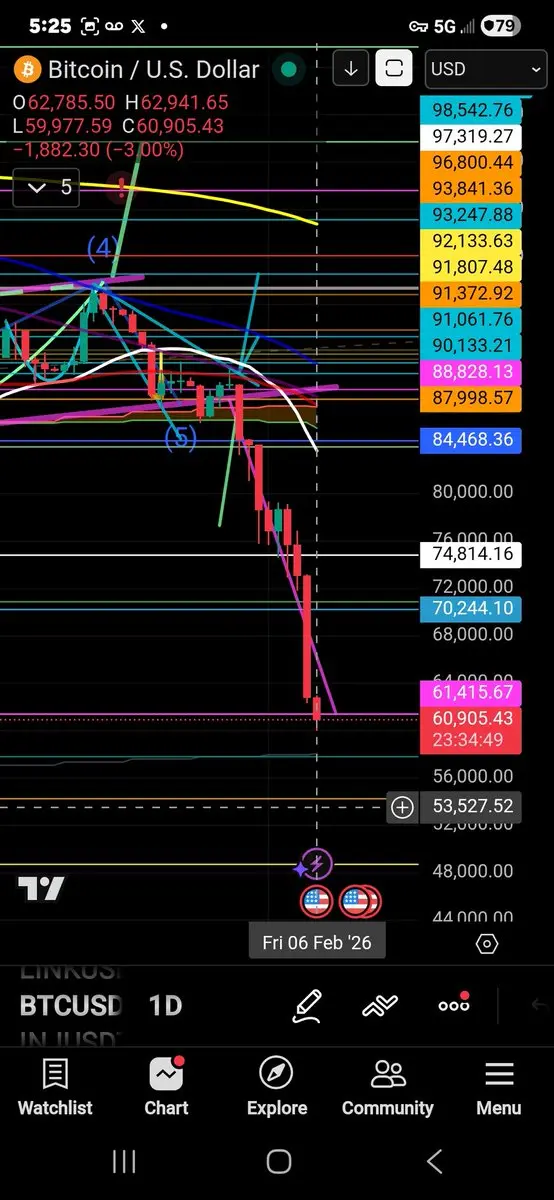
$BTC Bulls Vs The Bears
Bullish Adam & Eve Double Bottom Reversal Target $80,532
Bearish Bearflag Target $39-$40K
Targets are approximate until the breakdown or breakout occurs.
The bearish Target has way more potential than the bullish one.
Looking to get more $BTC with the profits when I sold near $78K.
NFA, DYOR ⚠️
#Crypto #Trading #BTC
BTC0,36%
- Reward
- like
- Comment
- Repost
- Share
- Reward
- like
- Comment
- Repost
- Share
- Reward
- 1
- Comment
- 1
- Share
- Reward
- like
- Comment
- Repost
- Share
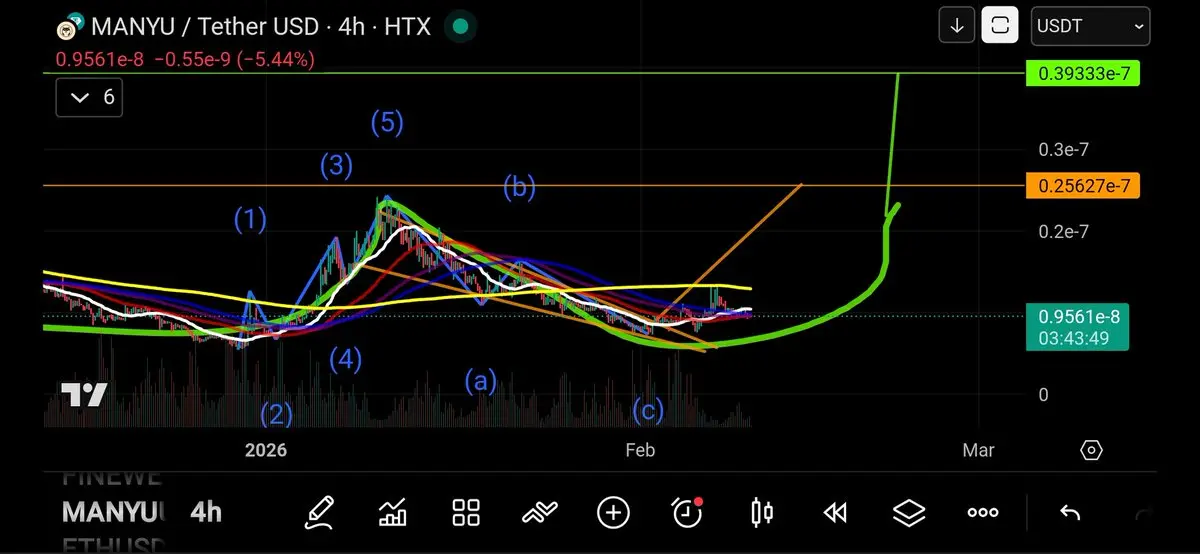
$MANYU Trying To Find Support Here
As stated previously price action needs to get back above the yellow 4hr 200MA.
We can see that price action tested the 4hr 200MA with that last pump to the upside.
Soon price must get above it or we could see more downside.
NFA, DYOR ⚠️
#Crypto #Trading #MANYU
As stated previously price action needs to get back above the yellow 4hr 200MA.
We can see that price action tested the 4hr 200MA with that last pump to the upside.
Soon price must get above it or we could see more downside.
NFA, DYOR ⚠️
#Crypto #Trading #MANYU
- Reward
- like
- Comment
- Repost
- Share
- Reward
- like
- Comment
- Repost
- Share
- Reward
- like
- Comment
- Repost
- Share
- Reward
- like
- Comment
- Repost
- Share
- Reward
- like
- Comment
- Repost
- Share
- Reward
- like
- Comment
- Repost
- Share
- Reward
- like
- Comment
- Repost
- Share
- Reward
- like
- Comment
- Repost
- Share
- Reward
- like
- Comment
- Repost
- Share
- Reward
- like
- Comment
- Repost
- Share
- Reward
- like
- Comment
- Repost
- Share
- Reward
- like
- Comment
- Repost
- Share
- Reward
- like
- Comment
- Repost
- Share
IM CALLING PRICE ACTION NEAR PERFECT!!!Look at how perfectly my targets have played major roles in price action.YOU CAN\'T MAKE THIS UP!!! CHECK THE TIMELINE.I TOLD YOU ATH/PEAKOCT/NOV LONG AGO.
- Reward
- like
- Comment
- Repost
- Share
- Reward
- like
- Comment
- Repost
- Share
Trending Topics
View More3.26K Popularity
1.9K Popularity
783 Popularity
31.73K Popularity
242.37K Popularity
Pin