Polkadot (DOT) has experienced a prolonged downtrend since March 2025. However, in the past week, DOT unexpectedly gained 4.41% — a notable short-term improvement signal. This development becomes especially significant as the cryptocurrency market remains under strong pressure from Bitcoin (BTC)'s unpredictable fluctuations, along with prevailing cautious sentiment and investor apprehension across the entire market.
Analyzing DOT trend across multiple timeframes
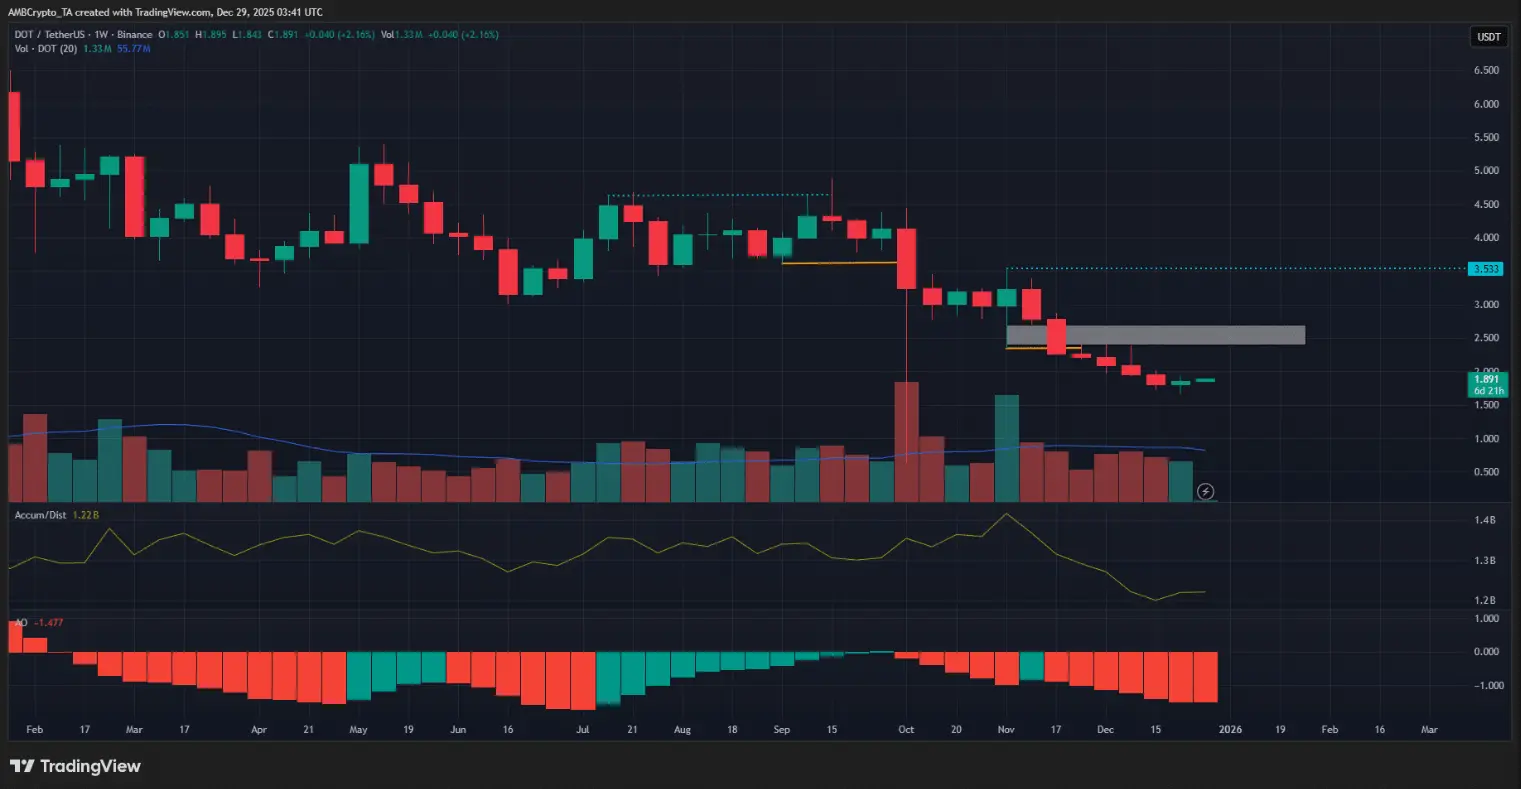
At the time of writing, Polkadot’s weekly trend still maintains a bearish tone. Breakdown points of the downtrend structure (orange) have appeared since September, while the oscillating structure on the weekly chart has continuously leaned toward a downtrend since March.
The A/D indicator reflects stable selling pressure, while the Awesome Oscillator emphasizes strong bearish momentum. The imbalance zone around $2.5 (white box) is considered a potential supply area, which could influence the price before DOT continues its decline on this timeframe.
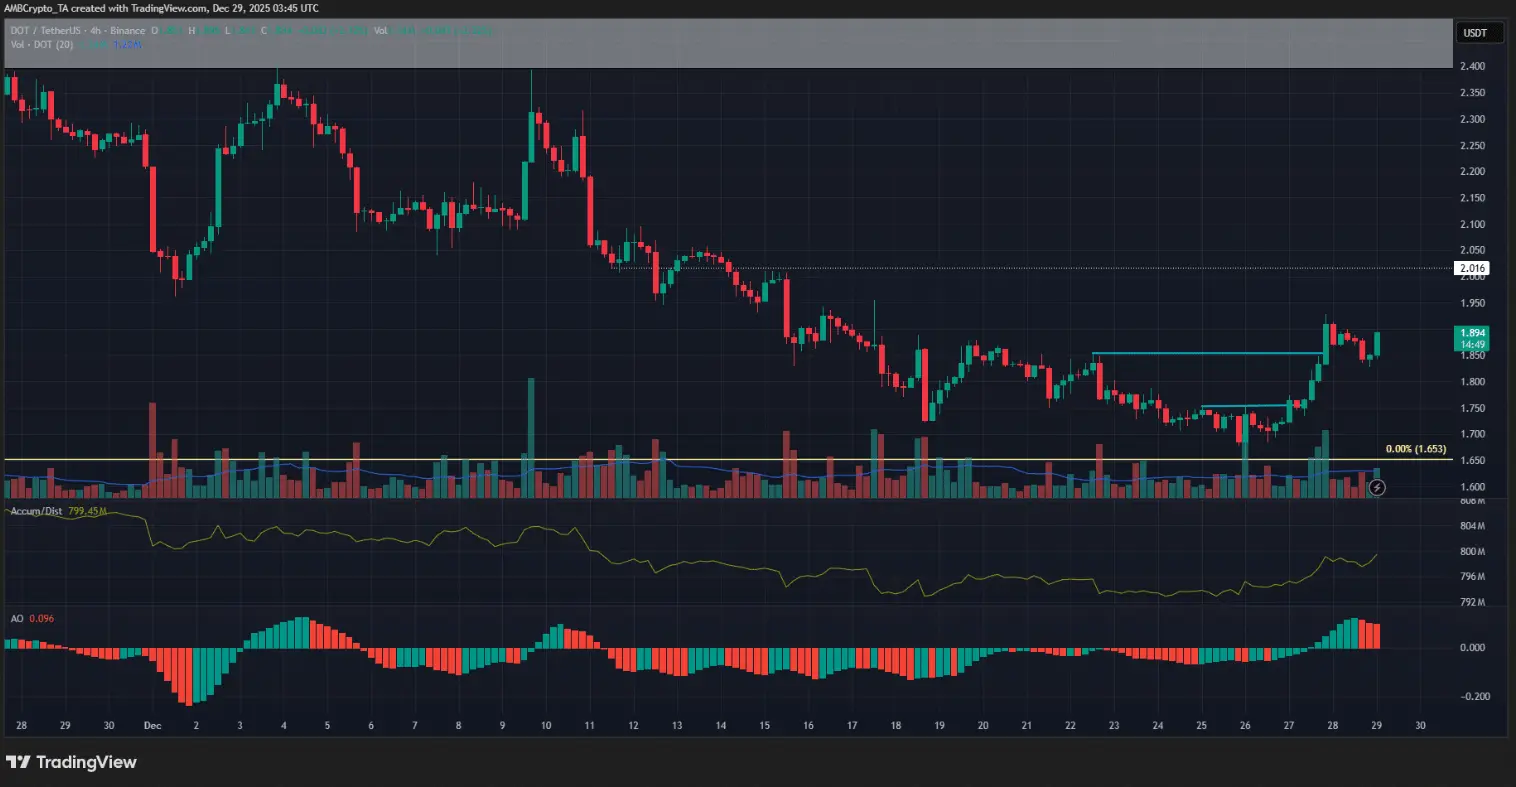
 Weekly DOT/USDT chart | Source: TradingViewMeanwhile, on the 4-hour chart, the bullish reversal trend has become clear over the past week. Two structure-breaking points of the upward trend were recorded when previous lows at $1.75 and $1.85 (blue) were broken.
The A/D indicator is rising, and the Awesome Oscillator shows increasing bullish momentum. The short-term upward trend on H4 could push DOT toward the psychological resistance level of $2, or even target the weekly supply zone around $2.5.
 4-hour DOT/USDT chart | Source: TradingView## Risks for DOT bulls
The resistance zone around $90,000 has become a strong barrier for Bitcoin in recent weeks. Although market liquidity has surged, BTC traders still need to exercise extreme caution. This also means that altcoins like Polkadot may face difficulties breaking out without support from sustainable demand.
On H4 and lower timeframes, current momentum favors the bulls. However, this short-term trend does not imply that the trend on higher timeframes will reverse. Long-term investors should closely monitor this rebound to make informed decisions.
Trader actions – Potential profit from the rebound
Cautious traders may choose to stay on the sidelines as the trend on higher timeframes remains bearish. On the H4 chart, the current upward momentum could reach $2.11. The 30-day liquidation map shows strong pressure from accumulated Short positions, laying the groundwork for the next rally.
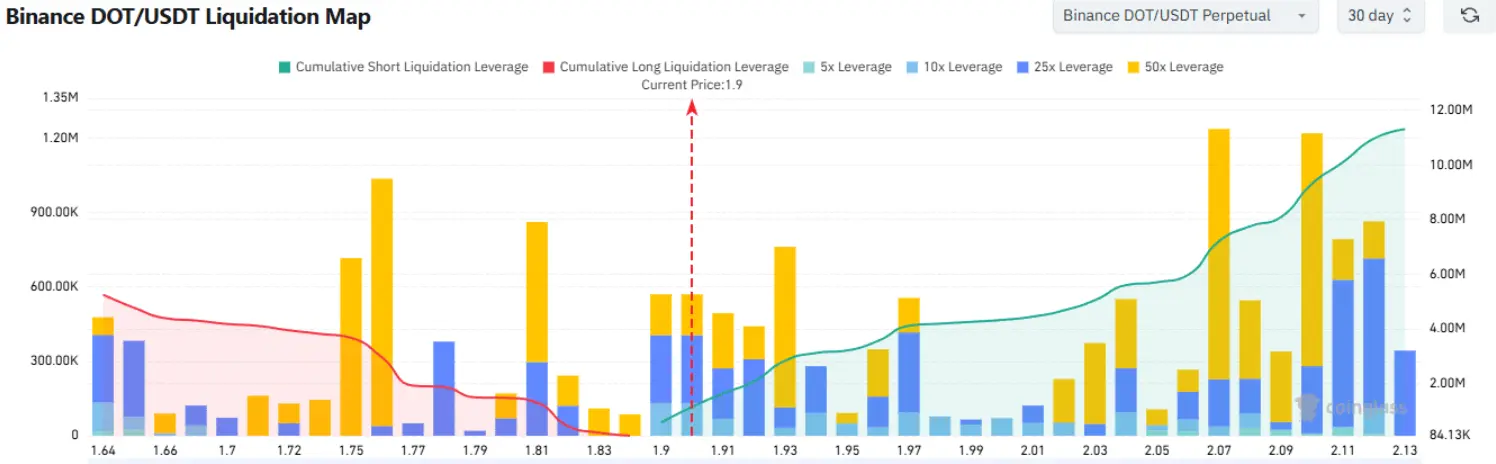 Source: CoinGlass The $2.11 target is attractive due to its proximity to a key liquidity zone. Traders might consider taking profits around $2.0–$2.1 to optimize gains. Conversely, if the price drops below $1.82, setting a Long order will become invalid, signaling a risk that traders should be aware of.
Disclaimer: The information on this page may come from third parties and does not represent the views or opinions of Gate. The content displayed on this page is for reference only and does not constitute any financial, investment, or legal advice. Gate does not guarantee the accuracy or completeness of the information and shall not be liable for any losses arising from the use of this information. Virtual asset investments carry high risks and are subject to significant price volatility. You may lose all of your invested principal. Please fully understand the relevant risks and make prudent decisions based on your own financial situation and risk tolerance. For details, please refer to
Disclaimer.
Related Articles
Bitcoin inflows to exchanges reach a new high, with $75,000 becoming a key resistance level
As the crypto market rebounds, on-chain capital inflows to Bitcoin have significantly increased, reaching the highest levels, indicating the market may face selling pressure. Meanwhile, prices are approaching short-term resistance zones, and macro interest rate policies remain a key factor. Market expectations for rate cuts have cooled, which could constrain risk assets.
GateNews11m ago
Grayscale Research Head Points to XRP Being Undervalued, Valuations Expected to Correct Rapidly After Regulatory Clarity
Grayscale Research Head Zach Pandl pointed out that XRP's market price does not reflect its actual utility, primarily due to regulatory uncertainty affecting its valuation. Once the CLARITY Act establishes clear cryptocurrency asset regulations, XRP is expected to be repriced. Additionally, growing market demand for the GXRP Trust product shows that institutional investors are positioning early, anticipating market opportunities following regulatory clarity.
MarketWhisper37m ago
TRUMP Coin Holders Rush to Trump's Mar-a-Lago Luncheon! Analysts: Beware of Post-Hype Pullback
Trump will host a luncheon on April 25th at his Mar-a-Lago estate in Florida, inviting top TRUMP token holders, causing the token's price to surge. The hype pattern before the event indicates that the token may decline after the event, with historical data supporting this view. Additionally, Congress is reviewing three bills to restrict politicians from profiting through meme coins, but they have not yet entered the voting stage.
MarketWhisper44m ago
Bitcoin dips back below $75,000 on the eve of the Federal Reserve decision
Bitcoin recently touched $75,000 but failed to sustain the level, pulling back to $74,000, reflecting cautious sentiment among investors ahead of the upcoming Federal Reserve interest rate decision. Geopolitical risks and elevated energy prices have driven inflation higher, affecting market expectations for rate cuts and pushing the timeline for cuts to year-end. Technical analysis shows Bitcoin remains strong but has not confirmed a decisive breakout above the $75,000 level, with limited upside potential in the near term.
区块客56m ago
XRP Today’s News: SEC Declares "Commodity" Not a Security, Exchange Orders Send Strong Buy Signal
On March 18, the SEC Chair announced that XRP was classified as a "digital commodity," ending regulatory uncertainty. On the same day, Coinbase displayed an XRP spot order book reaching a 9:1 buy-to-sell ratio, the strongest buyer signal. This development reduced compliance risks for holders, boosted institutional confidence, and paved the way for future financial product applications.
MarketWhisper1h ago
Uptrend Encountering Resistance? Analysis: Bitcoin Rebound May Face Headwinds Between $75,000 and $85,000
Bitcoin is currently around $74,611, facing resistance near the $75,000 level, with $85,000 being a larger resistance zone. Despite bullish signals appearing in the derivatives market and a short-term uptick in risk appetite, the increase in Bitcoin flowing into exchanges may bring profit-taking pressure. Market focus is concentrated on the Federal Reserve's interest rate decision, and if the results fall short of expectations, it will affect the sustainability of Bitcoin's rebound.
区块客1h ago
