Kaspa entered 2026 without much noise, yet the first few days of the year have already hinted at a possible shift. After a largely disappointing 2025 where Kaspa price struggled to hold momentum, KAS has opened the new year with a modest rebound. Roughly 20% upside since January began has pushed the token back into focus, especially as the broader crypto market starts to lean bullish.
This early move does not signal a trend change on its own, though it does show buyers stepping in sooner than many expected. With January still in its opening week, Kaspa price now sits at an important technical crossroads.
- Kaspa Price Action Shows Early Strength After A Tough 2025
- Kaspa Still Trades Inside A Descending Channel From 2024
- Kaspa Support Near $0.037 Helped Trigger The Current Bounce
- Super Bullish Kaspa Price Scenario Points Toward $0.08
- Bearish Kaspa Price Scenario Brings Focus Back To $0.03 Support
Kaspa Price Action Shows Early Strength After A Tough 2025
Kaspa price spent much of 2025 underperforming expectations. Repeated attempts to build sustained momentum failed, leaving KAS trapped in a prolonged cooling phase. That weakness followed the strong rally seen during mid 2024, when Kaspa reached a new all time high before momentum faded.
January brought a different tone. Price climbed roughly 20% from the start of the year, reflecting improving sentiment across the crypto market rather than a sudden shift in Kaspa fundamentals. Strength across majors often spills into high beta assets like KAS, creating short term upside even when larger trends remain undecided.
This early move matters because it shows buyers stepping in again after months of hesitation.
Kaspa Still Trades Inside A Descending Channel From 2024
Technical structure remains the biggest restraint on Kaspa price. Since the mid 2024 peak, KAS has traded inside a clear descending channel. Lower highs and controlled rebounds defined most of 2025, reinforcing a broader corrective phase rather than a trend reversal.
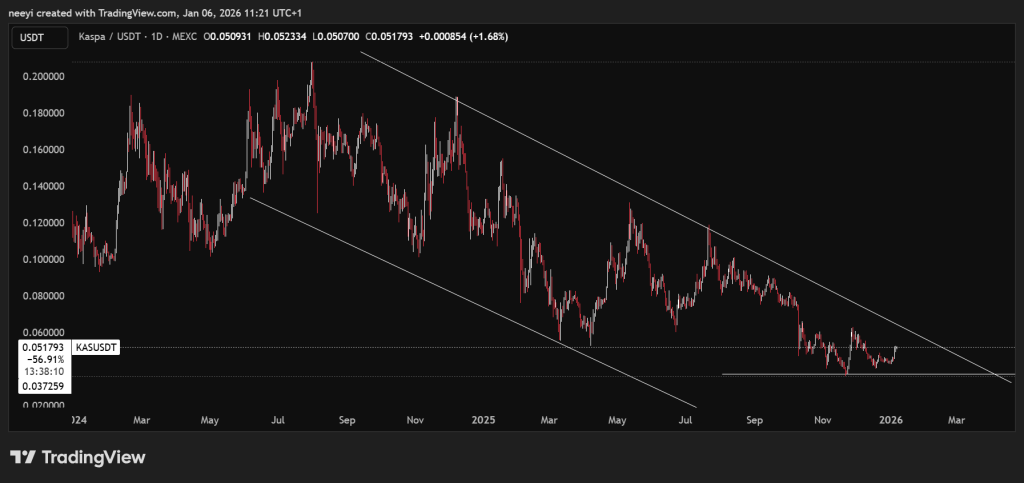
KAS Price Chart
January does not appear to change that structure yet. Price continues to respect the channel boundaries, suggesting the current move higher still fits within a larger consolidation. Breakouts above this pattern usually require strong follow through and broader market support.
Continuation inside this channel remains the most realistic short term expectation for KAS price.
Kaspa Support Near $0.037 Helped Trigger The Current Bounce
December provided an important technical development. Kaspa price tested support around $0.037 and held firmly. Buyers defended that zone multiple times, creating a base that allowed price to rebound as the new year began.
That support acted as a springboard, pushing KAS toward higher levels without heavy selling pressure. Current trading around $0.05 places price closer to the upper boundary of the descending channel, an area that often attracts cautious behavior from buyers. Support strength at $0.037 remains a key reference point for January.
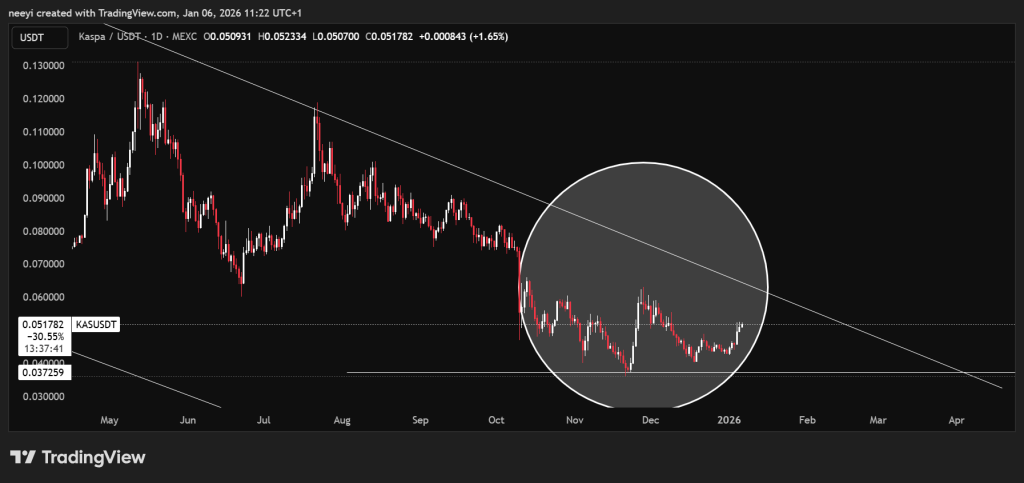
KAS Price Chart
As KAS price moves higher, resistance becomes more visible. The top of the descending channel sits not far above current levels, making sustained upside difficult without a strong catalyst. Many rallies within similar structures stall before achieving a full breakout.
This area often triggers profit taking, especially among short term traders who recognize the broader trend remains corrective. Without a decisive move above the channel, upside may remain limited despite improving sentiment.
Kaspa price nearing resistance creates a moment where patience becomes essential.
Super Bullish Kaspa Price Scenario Points Toward $0.08
A highly bullish outcome would require a clear break above the descending channel. Such a move would signal a structural shift rather than a simple retracement. Under that scenario, Kaspa price could extend toward the $0.08 region during January, especially if market momentum accelerates.
That outcome depends heavily on broader crypto strength. Sustained buying pressure across the market often gives smaller-cap projects room to break technical ceilings that previously capped price action.
This scenario remains possible, though confirmation would require strong follow-through.
Bearish Kaspa Price Scenario Brings Focus Back To $0.03 Support
Caution still applies. The broader pattern remains bearish, meaning the current move higher can still be interpreted as a bullish retracement rather than a trend reversal. Failure to hold higher levels could invite renewed selling pressure.
A bearish outcome would likely push Kaspa price back toward the $0.03 zone, where prior support proved reliable. Retesting that level would not automatically signal weakness, though repeated tests often increase risk over time. Price behavior near that support will matter if momentum fades.
How Much Might 20,000 Hedera (HBAR) Tokens Be Worth in 2026?_**
January opens with renewed interest in Kaspa, supported by improving market sentiment and a solid technical bounce. KAS price has recovered meaningfully, yet structure still limits expectations. Descending channel resistance remains the defining factor, shaping both bullish and bearish scenario
Disclaimer: The information on this page may come from third parties and does not represent the views or opinions of Gate. The content displayed on this page is for reference only and does not constitute any financial, investment, or legal advice. Gate does not guarantee the accuracy or completeness of the information and shall not be liable for any losses arising from the use of this information. Virtual asset investments carry high risks and are subject to significant price volatility. You may lose all of your invested principal. Please fully understand the relevant risks and make prudent decisions based on your own financial situation and risk tolerance. For details, please refer to
Disclaimer.
Related Articles
Here’s the XRP Price If Banks Start Treating Ripple as the Ultimate “Integration Play”
Ripple’s XRP price moved up a bit today, but the overall picture still feels uncertain. The token dropped heavily over the past few months, and many traders are still careful.
Online discussions show mixed feelings. Some think the recent drop may have formed a short-term bottom. However, many
CaptainAltcoin12m ago
Bitcoin Price Predictions Flip Bullish, But Ethereum Is Still Stuck
Predictors have turned bullish on Bitcoin's near-term price, suggesting a rise to $84,000 before a potential drop. However, analysts remain divided on sustainability, while sentiment for Ethereum is bearish, with expectations of a decline to $1,500.
Decrypt46m ago
SHIB Faces Critical Breakout Test as Forecast Points to Short-Term 7.47% Gain
Shiba Inu (SHIB) is trading close to the support level of $0.05545, showing a recent decline but also potential for a 7.47% upside by March 2026. The price remains within established boundaries, facing key resistance at $0.055727. Future movements depend on breaking above resistance or falling below support.
CryptoNewsLand47m ago
XRP Reclaims $1.39 After $1.69M Liquidation Spike — Can Price Break $1.43 Today?
XRP has rebounded to $1.39 after an 8.2% gain, following a significant liquidation event that targeted overleveraged long positions. Current support is at $1.27, with resistance at $1.43. Market dynamics suggest cautious bullish momentum may continue, while bearish pressure could emerge if resistance fails.
CryptoNewsLand51m ago
ETH short-term decline of 1.12%: macro liquidity disturbances and whale position reduction resonance intensify volatility
On March 5, 2026, from 16:00 to 16:15 (UTC), the price of Ethereum (ETH) recorded a -1.12% return within 15 minutes, with a price range of 2056.69 to 2087.34 USDT, and an amplitude of 1.47%. Market attention during this period significantly increased, volatility intensified, mainstream coins experienced a synchronized pullback, and short-term traders engaged in frequent speculative battles.
The main driver of this fluctuation is macro-level liquidity disturbances. As the Federal Reserve's interest rate decision approaches and the U.S. non-farm payroll data is set to be released on March 6, the market shows divergence in the pace of rate cuts, prompting some short-term funds to choose
GateNews1h ago
BTC 15-minute sharp decline of 0.90%: liquidity gap area and macro risk aversion resonate, triggering short-term selling pressure
On March 5, 2026, from 16:00 to 16:15 (UTC), Bitcoin (BTC) experienced a -0.90% return within a short time window, with the price ranging from 70,800.8 to 71,653.9 USDT, and an amplitude of 1.19%. This anomaly occurred amid heightened market attention, with volatility significantly increasing, investor sentiment turning cautious, and trading volume and on-chain activity remaining high, intensifying short-term trading pressure.
The main driver of this anomaly is that BTC is in a "gap zone" — meaning liquidity above 72,000 USDT is extremely thin, with only about 1% of circulation.
GateNews1h ago

