
**Date: **Mon, Jan 05, 2026 | 07:55 AM GMT
As 2026 kicks off, the broader cryptocurrency market is showing renewed stability. Ethereum (ETH) is up around 4% on the week, and improving sentiment is gradually spreading across major altcoins — including Ethena (ENA).
ENA has already surged more than 14% on a weekly basis, but the more important development is unfolding beneath the surface. While short-term strength is encouraging, the bigger story lies in the structure forming on the chart. Recent price action suggests a meaningful shift in market behavior — one that could mark the early stages of a bullish continuation if key resistance levels are reclaimed.
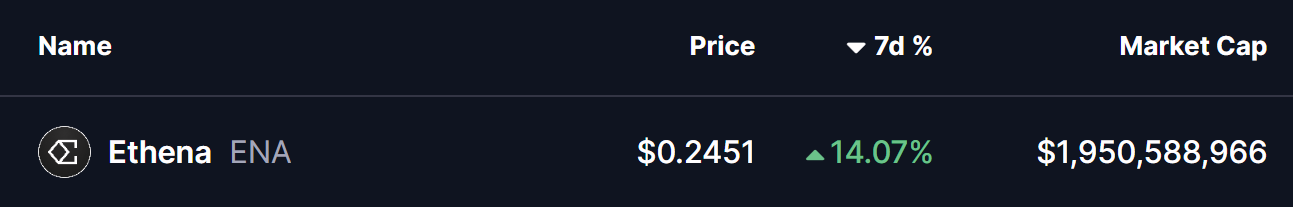
Source: Coinmarketcap
Rounding Bottom in Play
On the daily timeframe, ENA appears to be forming a rounding bottom pattern, a classic bullish reversal structure that typically develops after a prolonged corrective phase.
The setup began after ENA faced a firm rejection near the $0.3028–$0.2837 resistance zone late last month. That rejection triggered a sharp decline, dragging price down toward the $0.1935 area. Importantly, sellers failed to push price meaningfully lower from there, and strong demand emerged at those levels. Over time, ENA stabilized, volatility compressed, and price began to curl higher — completing the rounded base structure.
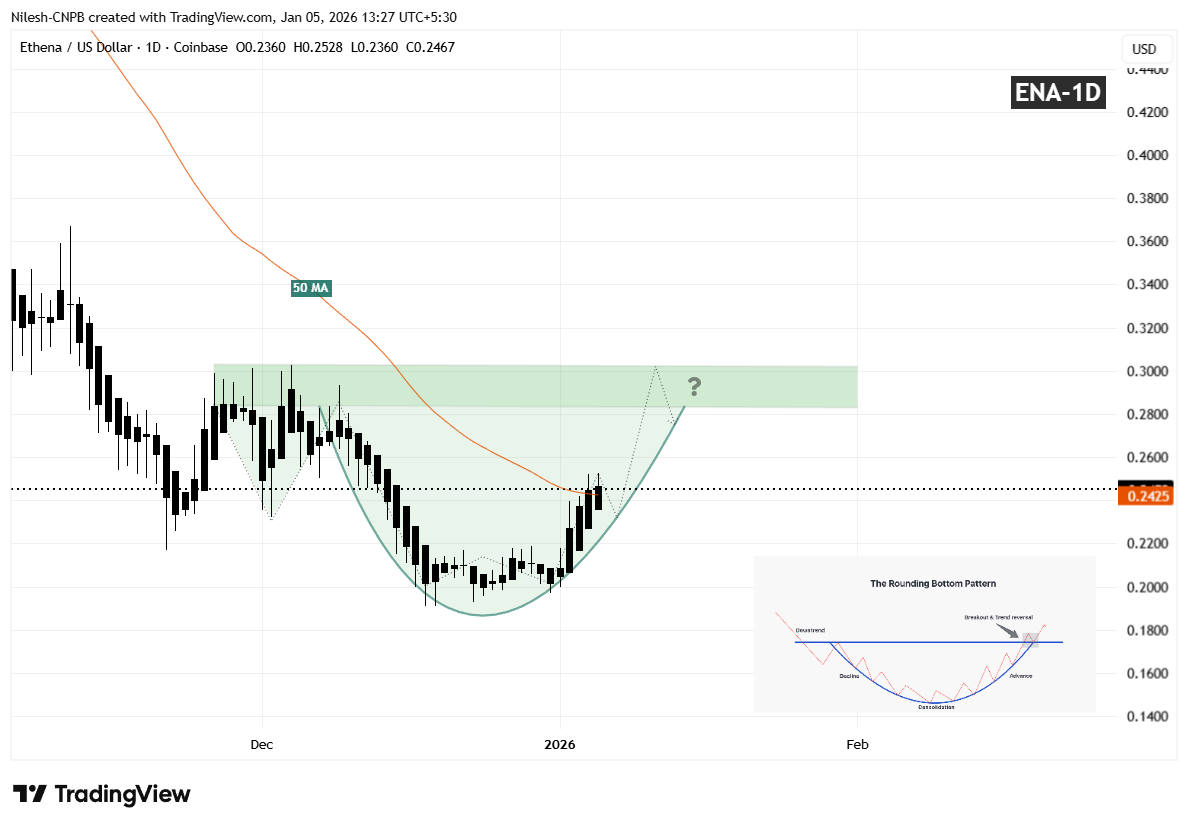
Ethena (ENA) Daily Chart/Coinsprobe (Source: Tradingview)
Since carving out that bottom, ENA has started to move higher in a smooth, rounded fashion, closely matching the textbook characteristics of a developing rounding bottom. The recent recovery has also brought price back toward the 50-day moving average near $0.2451, a level that previously acted as resistance and is now being tested as potential support.
What’s Next for ENA?
If ENA continues to hold above the 50-day MA, that level could act as a solid short-term base for further upside attempts. A clean and decisive breakout above the $0.3028–$0.2837 resistance zone, followed by sustained acceptance above it, would validate the entire reversal pattern and likely open the door for a broader bullish expansion phase.
Until such a breakout occurs, the pattern remains in development. Short-term consolidation or shallow pullbacks remain possible as price digests recent gains. However, as long as ENA continues to form higher lows above the established base, the broader bottoming structure remains intact and constructive.
For now, the chart suggests ENA is approaching a critical confirmation phase — one that could determine whether this recovery evolves into a sustained bullish trend as the new year unfolds.
Disclaimer: The views and analysis presented in this article are for informational purposes only and reflect the author’s perspective, not financial advice. Technical patterns and indicators discussed are subject to market volatility and may or may not yield the anticipated results. Investors are advised to exercise caution, conduct independent research, and make decisions aligned with their individual risk tolerance.
About Author: Nilesh Hembade is the Founder and Lead Author of Coinsprobe, with over 5 years of experience in the cryptocurrency and blockchain industry. Since launching Coinsprobe in 2023, he has been providing daily, research-driven insights through in-depth market analysis, on-chain data, and technical research.
Disclaimer: The information on this page may come from third parties and does not represent the views or opinions of Gate. The content displayed on this page is for reference only and does not constitute any financial, investment, or legal advice. Gate does not guarantee the accuracy or completeness of the information and shall not be liable for any losses arising from the use of this information. Virtual asset investments carry high risks and are subject to significant price volatility. You may lose all of your invested principal. Please fully understand the relevant risks and make prudent decisions based on your own financial situation and risk tolerance. For details, please refer to
Disclaimer.
Related Articles
Bitcoin Price Predictions Flip Bullish, But Ethereum Is Still Stuck
Predictors have turned bullish on Bitcoin's near-term price, suggesting a rise to $84,000 before a potential drop. However, analysts remain divided on sustainability, while sentiment for Ethereum is bearish, with expectations of a decline to $1,500.
Decrypt29m ago
SHIB Faces Critical Breakout Test as Forecast Points to Short-Term 7.47% Gain
Shiba Inu (SHIB) is trading close to the support level of $0.05545, showing a recent decline but also potential for a 7.47% upside by March 2026. The price remains within established boundaries, facing key resistance at $0.055727. Future movements depend on breaking above resistance or falling below support.
CryptoNewsLand30m ago
XRP Reclaims $1.39 After $1.69M Liquidation Spike — Can Price Break $1.43 Today?
XRP has rebounded to $1.39 after an 8.2% gain, following a significant liquidation event that targeted overleveraged long positions. Current support is at $1.27, with resistance at $1.43. Market dynamics suggest cautious bullish momentum may continue, while bearish pressure could emerge if resistance fails.
CryptoNewsLand34m ago
ETH short-term decline of 1.12%: macro liquidity disturbances and whale position reduction resonance intensify volatility
On March 5, 2026, from 16:00 to 16:15 (UTC), the price of Ethereum (ETH) recorded a -1.12% return within 15 minutes, with a price range of 2056.69 to 2087.34 USDT, and an amplitude of 1.47%. Market attention during this period significantly increased, volatility intensified, mainstream coins experienced a synchronized pullback, and short-term traders engaged in frequent speculative battles.
The main driver of this fluctuation is macro-level liquidity disturbances. As the Federal Reserve's interest rate decision approaches and the U.S. non-farm payroll data is set to be released on March 6, the market shows divergence in the pace of rate cuts, prompting some short-term funds to choose
GateNews53m ago
BTC 15-minute sharp decline of 0.90%: liquidity gap area and macro risk aversion resonate, triggering short-term selling pressure
On March 5, 2026, from 16:00 to 16:15 (UTC), Bitcoin (BTC) experienced a -0.90% return within a short time window, with the price ranging from 70,800.8 to 71,653.9 USDT, and an amplitude of 1.19%. This anomaly occurred amid heightened market attention, with volatility significantly increasing, investor sentiment turning cautious, and trading volume and on-chain activity remaining high, intensifying short-term trading pressure.
The main driver of this anomaly is that BTC is in a "gap zone" — meaning liquidity above 72,000 USDT is extremely thin, with only about 1% of circulation.
GateNews53m ago
Bit Digital CEO: Ethereum has stabilized in the $1800–$2100 range, and the recent pullback is more like a "value reset"
Bit Digital CEO Sam Tabar stated that recent Ethereum market conditions resemble a "value reset," with market leverage rapidly re-evaluating after a significant increase, leading to increased volatility. Currently, the price remains stable in the $1800 to $2100 range, with fundamentals unchanged. This event demonstrates how leverage can distort the market, but Ethereum's long-term value remains solid.
GateNews1h ago

