
Date: Fri, Jan 02, 2026 | 06:20 AM GMT
The broader cryptocurrency market has started the new year on a positive note, with both Bitcoin (BTC) and Ethereum (ETH) trading slightly higher and posting gains of over 1%. This modest recovery in major assets has helped stabilize sentiment across the market, allowing several altcoins to attract renewed interest — including the newly listed DEX token, Lighter (LIT).
Following its massive airdrop event, where 25% of the total supply (250 million LIT, valued at approximately $675 million at launch) was distributed, LIT initially faced notable selling pressure. However, price action has remained surprisingly resilient. After absorbing early profit-taking, LIT has stabilized and is now trading with a fresh 7% upside move. More importantly, the lower timeframe technical structure suggests that the token may be positioning itself for a stronger breakout move ahead.
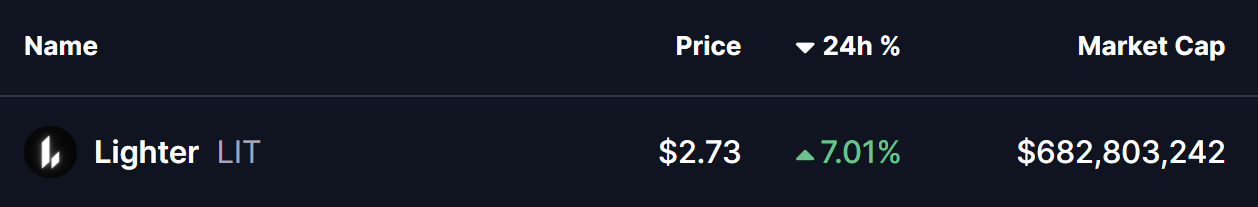
Source: Coinmarketcap
Inverse Head and Shoulders Pattern Signals Bullish Potential
On the 2-hour chart, LIT’s recent price action appears to be forming a classic inverse head and shoulders pattern — a widely followed bullish reversal structure. This formation consists of three distinct dips, with the central decline marking the deepest low, flanked by two higher lows that form the left and right shoulders.
In LIT’s case, the head was established near the $2.34 region, while the left and right shoulders developed around the $2.63–$2.65 zone. This structure highlights a clear shift in momentum, as sellers gradually lose control and buyers step in earlier on each pullback.
The neckline resistance is clearly defined around the $2.82 level, which has been tested multiple times but remains unbroken for now. Each attempt has been met with temporary rejection, yet the inability of price to break back below support suggests growing buying interest beneath the surface.
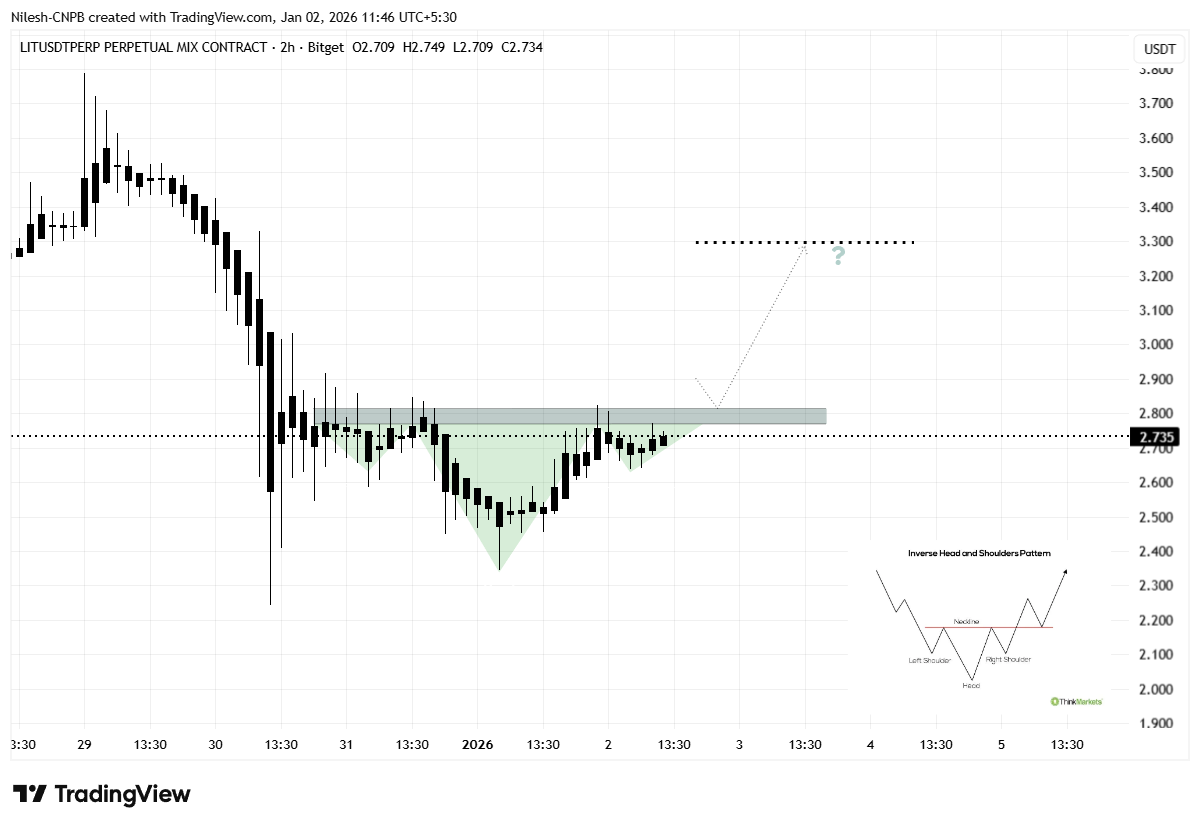
Lighter (LIT) 2H Chart/Coinsprobe (Source: Tradingview)
The most recent rebound from the right shoulder pushed LIT back toward the $2.73 area, keeping price compressed just below the neckline. This tightening price action reflects steady accumulation and reinforces the idea that demand remains firm despite the lack of a confirmed breakout so far.
What’s Ahead for LIT?
From here, LIT appears to be setting up for another challenge of the $2.82 neckline resistance. A decisive breakout above this zone, followed by a sustained close and a successful retest as support, would validate the inverse head and shoulders structure and likely trigger a bullish expansion phase.
Based on the measured move of the pattern, the technical upside projection points toward the $3.29 region. This level represents a potential upside of roughly 20% from current prices and also aligns with prior horizontal resistance, strengthening the bullish outlook if the breakout materializes.
That said, caution remains warranted as this pattern is forming on a lower timeframe. Failure to reclaim and hold above the neckline could result in continued consolidation or a pullback toward the $2.60–$2.65 support region. As long as these higher lows remain intact, the broader bullish structure would stay valid.
For now, the combination of improving market sentiment, strong post-airdrop absorption, and a tightening inverse head and shoulders formation suggests that Lighter is approaching a critical decision point — one that could define its next directional move in the days ahead.
Disclaimer: The views and analysis presented in this article are for informational purposes only and reflect the author’s perspective, not financial advice. Technical patterns and indicators discussed are subject to market volatility and may or may not yield the anticipated results. Investors are advised to exercise caution, conduct independent research, and make decisions aligned with their individual risk tolerance.
About Author: Nilesh Hembade is the Founder and Lead Author of Coinsprobe, with over 5 years of experience in the cryptocurrency and blockchain industry. Since launching Coinsprobe in 2023, he has been providing daily, research-driven insights through in-depth market analysis, on-chain data, and technical research.
Disclaimer: The information on this page may come from third parties and does not represent the views or opinions of Gate. The content displayed on this page is for reference only and does not constitute any financial, investment, or legal advice. Gate does not guarantee the accuracy or completeness of the information and shall not be liable for any losses arising from the use of this information. Virtual asset investments carry high risks and are subject to significant price volatility. You may lose all of your invested principal. Please fully understand the relevant risks and make prudent decisions based on your own financial situation and risk tolerance. For details, please refer to
Disclaimer.
Related Articles
Supported by ETF fund inflows, Bitcoin shows "strong" rebound near $72,800
Under the influence of capital inflows into U.S. spot cryptocurrency ETFs, Bitcoin prices stabilized last week and touched a high of 73,927 USD, with gains of approximately 6% to 7%. Ethereum also rebounded, indicating a recovery in market risk appetite. ETF capital inflows became the main support factor. Despite volatility in macroeconomic market sentiment, reassuring commentary on inflation and oil price risks helped stabilize prices.
区块客16m ago
Bitcoin Breaks Through $74,000 Resistance Level, Crypto Market Strengthens Collectively, ETH and SOL Lead Weekly Gains
On March 16, the crypto market continued to rise, with Bitcoin surpassing $74,000, up 2.9% in 24 hours. Ethereum and Solana showed larger gains, indicating capital flowing toward higher-risk crypto assets. An improving macroeconomic environment provided market support, with falling oil prices and a weakening dollar aiding liquidity release. The market is focused on the upcoming Federal Reserve meeting, which could impact future interest rate expectations.
GateNews25m ago
Bitcoin Breaks Above 50-Day Moving Average Approaching $74,000, BTC Upward Momentum Strengthens But $75,000 May Become Key Resistance Level
Bitcoin's price surged over 3% on March 16, reclaiming the 50-day moving average and breaking through $71,125, indicating strengthened market momentum. Despite external uncertainties, Bitcoin demonstrated resilience and gradually recovered above the $70,000 level. Analysts noted that stabilization above the 50-day moving average may signal a trend reversal, but technical breakthroughs don't necessarily guarantee long-term gains. The market is watching whether Bitcoin can break through $75,000, with trading volume and capital inflows being key factors.
GateNews29m ago
Bitcoin Breaks Through $73,000! Outperforms Gold Amid US-Iran War, EF Sells 10.2 Million ETH
Bitcoin recently broke through $73,000 with strong performance, decoupling from tech stocks and gold. Analysts predict that if the market stabilizes, it could rise to $75,000 to $80,000. However, geopolitical risks and extremely fearful market sentiment continue to pressure prices. Meanwhile, the Ethereum Foundation sold Ether for approximately $10.2 million to maintain operations.
CryptoCity1h ago
On-chain activity is exploding, but Ethereum can't seem to gain momentum? Experts reveal the "fatal weakness": could drop to $1,500
CryptoQuant's latest report indicates that Ethereum is facing an "adoption paradox," where network activity reaches new highs, but the token price continues to decline. Analysts predict that if the bear market persists, Ether could fall to $1,500. Despite thriving on-chain activity, it has decoupled from the token price, and the high proportion of Ether flowing into exchanges suggests heavy selling pressure and weak investment demand.
区块客1h ago