
**Date: **Sat, Jan 03, 2026 | 04:25 PM GMT
As 2026 kicks off, the broader cryptocurrency market is showing renewed stability. Ethereum (ETH) has reclaimed the $3,100 level, and momentum is gradually rotating into select altcoins — including World Liberty Financial (WLFI).
WLFI has jumped nearly 9% on the day, extending its weekly gains to around 16%, but the more important development is unfolding on the chart. On lower timeframes, price action is forming a well-defined bullish structure, suggesting that the token may be gearing up for a meaningful breakout if key levels are reclaimed.
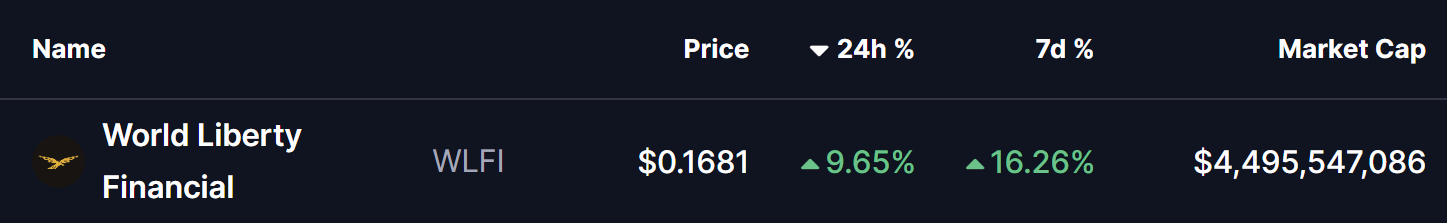
Source: Coinmarketcap
Ascending Triangle In Play
On the 4-hour chart, WLFI is forming a clear ascending triangle, characterized by a series of higher lows pushing steadily into a flat resistance zone. This pattern is widely viewed as a bullish continuation setup, especially when it develops during a prolonged consolidation phase accompanied by consistent dip-buying.
WLFI recently faced rejection near the $0.1741 resistance zone, which capped multiple upside attempts. That rejection pushed price back toward the rising support trendline, with buyers stepping in around the $0.1222 region. Importantly, each pullback has been shallower than the last, reinforcing the presence of strong underlying demand.
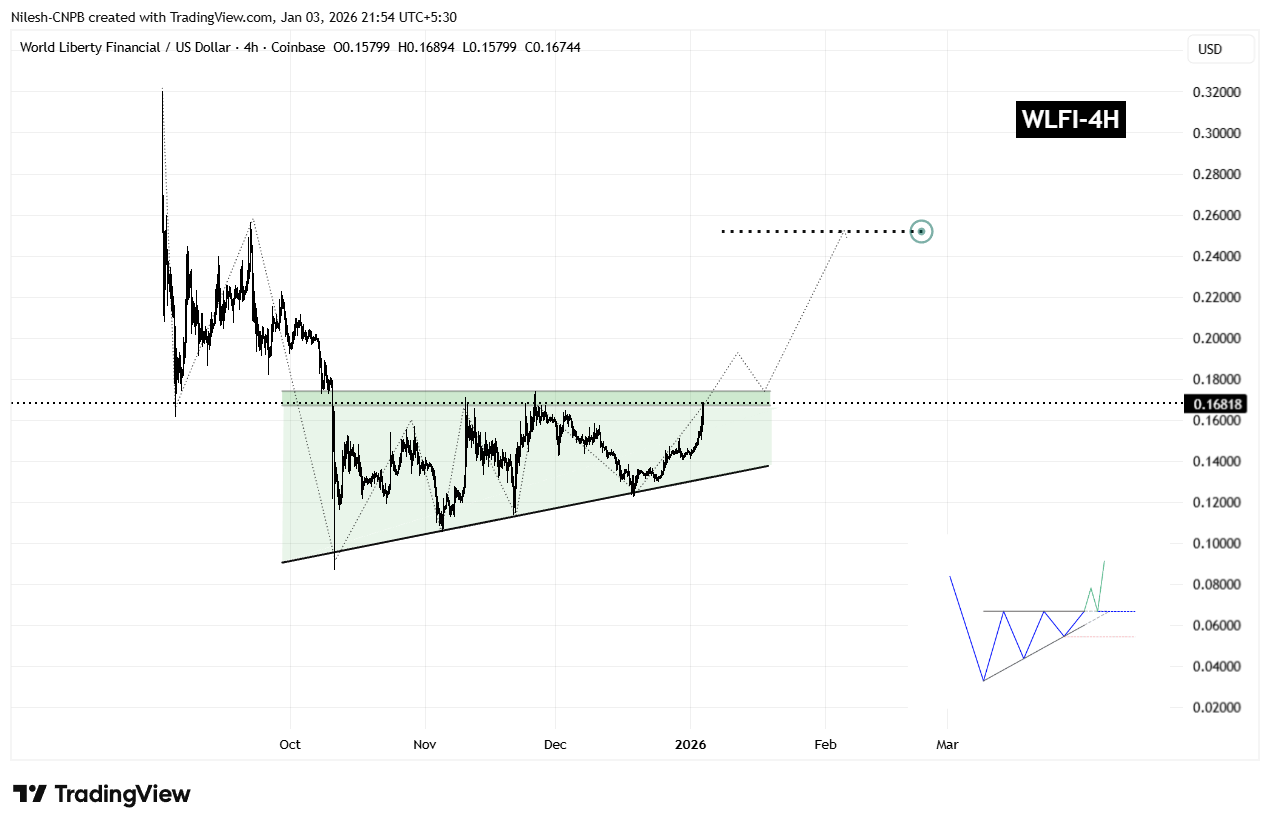
WLFI 4H Chart/Coinsprobe (Source: Tradingview)
The latest rebound has once again carried WLFI toward the upper boundary of the triangle, reinforcing the idea that demand remains firm. Rather than signaling weakness, this sideways-to-higher price action reflects healthy consolidation as volatility tightens ahead of a potential breakout.
What’s Next for WLFI?
From here, WLFI appears poised for another test of the $0.1741 resistance. A decisive breakout above this level, followed by a sustained close and a successful retest as support, would confirm the ascending triangle pattern and likely trigger a broader bullish expansion phase.
Based on the measured move of the formation, the technical upside projection points toward the $0.2522 region. This target represents a potential upside of roughly 48% from current levels and also aligns with prior price structure, strengthening the bullish case.
That said, caution remains warranted. If WLFI fails to break above resistance, price could once again rotate back toward the rising support trendline. As long as this trendline continues to hold, the broader bullish structure remains intact. A decisive breakdown below ascending support, however, would invalidate the pattern and delay any breakout scenario.
For now, the combination of improving market sentiment, steady accumulation, and a tightening ascending triangle suggests that WLFI is approaching a critical inflection point — one that could define its next major move as the new year unfolds.
Disclaimer: The views and analysis presented in this article are for informational purposes only and reflect the author’s perspective, not financial advice. Technical patterns and indicators discussed are subject to market volatility and may or may not yield the anticipated results. Investors are advised to exercise caution, conduct independent research, and make decisions aligned with their individual risk tolerance.
About Author: Nilesh Hembade is the Founder and Lead Author of Coinsprobe, with over 5 years of experience in the cryptocurrency and blockchain industry. Since launching Coinsprobe in 2023, he has been providing daily, research-driven insights through in-depth market analysis, on-chain data, and technical research.
Disclaimer: The information on this page may come from third parties and does not represent the views or opinions of Gate. The content displayed on this page is for reference only and does not constitute any financial, investment, or legal advice. Gate does not guarantee the accuracy or completeness of the information and shall not be liable for any losses arising from the use of this information. Virtual asset investments carry high risks and are subject to significant price volatility. You may lose all of your invested principal. Please fully understand the relevant risks and make prudent decisions based on your own financial situation and risk tolerance. For details, please refer to
Disclaimer.
Related Articles
TAO Price Pumps Another 20% as Bittensor Delivers What No Other AI Crypto Could
Bittensor's TAO token surged 20% today, achieving over 60% gains in the last month, following the completion of a groundbreaking decentralized language model. Market sentiments are high, signaling strong investor interest in Bittensor's technology.
CaptainAltcoin24m ago
BTC 15分钟下跌0.67%:宏观避险情绪与衍生品去杠杆共振放大卖压
2026年3月13日15:30至15:45(UTC),比特币(BTC)在71886.1至72602.0 USDT区间震荡,振幅0.99%,最终15分钟内下跌0.67%。该时段成交量较前一小时显著放大,多头仓位出现集中止损,短线波动引发市场高度关注,情绪维持极度谨慎。
本次异动的主要驱动力在于全球地缘政治局势紧张和通胀预期走高。美国与伊朗冲突升级导致布伦特原油价格维持在100美元/桶以上,市场对
GateNews38m ago
BTC 15分钟下跌1.06%:油价冲击与杠杆强平共振引发抛售压力
2026-03-13 14:30 至 14:45(UTC),BTC在15分钟内收益率录得-1.06%,K线价格区间为72933.4至73896.0 USDT,振幅达1.31%。短时间市场波动明显加剧,交易活跃度与关注度同步走高。
本次异动的主要驱动力是全球油价因美以对伊朗军事行动急飙至100美元上方,触发通胀预期升温和美联储降息可能性的下降,导致全球风险偏好大幅回撤。比特币作为流动性最强的风险
GateNews1h ago
Bitcoin Shows Value Bottom Signals but True Market Floor Missing
Bitcoin is at a "Value Bottom" ideal for long-term dollar-cost averaging, but has not yet reached a "Structural Bottom," leading to projected volatility between $60K-$70K. Investors should prepare for continued fluctuations and potential buying opportunities.
BlockChainReporter2h ago
Bitcoin Trades Narrow Range As Resistance Holds Near $71K
Bitcoin is trading around $70,335, showing a 2.13% decline in 24 hours. Analysts note a resistance near $71,400 and a consolidation phase, with traders awaiting a decisive breakout above or below established support and resistance levels.
CryptoBreaking2h ago
BTC 15-minute rise of 0.60%: ETF capital inflows and technical breakout resonance drive short-term momentum
2026-03-13 12:45 to 2026-03-13 13:00 (UTC), BTC achieved a +0.60% return within 15 minutes, with a price range of 72341.6-72888.0 USDT and a volatility amplitude of 0.76%. Short-term price oscillations noticeably intensified. Due to abundant trading volume, market attention rose rapidly, reflecting a phase of strengthened buying power.
The primary drivers of this movement are continuous net inflows into ETFs and a technical breakout of key structures. In March 2026, BTC spot ETFs attracted capital inflows as high as 1.6 billion dollars in a single week.
GateNews3h ago