
**Date: **Mon, Jan 05, 2026 | 07:55 AM GMT
As 2026 kicks off, the broader cryptocurrency market is showing renewed stability. Ethereum (ETH) is up around 4% on the week, and improving sentiment is gradually spreading across major altcoins — including Ethena (ENA).
ENA has already surged more than 14% on a weekly basis, but the more important development is unfolding beneath the surface. While short-term strength is encouraging, the bigger story lies in the structure forming on the chart. Recent price action suggests a meaningful shift in market behavior — one that could mark the early stages of a bullish continuation if key resistance levels are reclaimed.
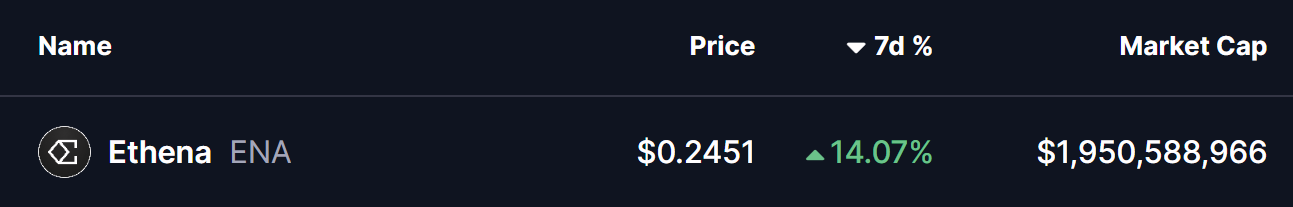
Source: Coinmarketcap
Rounding Bottom in Play
On the daily timeframe, ENA appears to be forming a rounding bottom pattern, a classic bullish reversal structure that typically develops after a prolonged corrective phase.
The setup began after ENA faced a firm rejection near the $0.3028–$0.2837 resistance zone late last month. That rejection triggered a sharp decline, dragging price down toward the $0.1935 area. Importantly, sellers failed to push price meaningfully lower from there, and strong demand emerged at those levels. Over time, ENA stabilized, volatility compressed, and price began to curl higher — completing the rounded base structure.
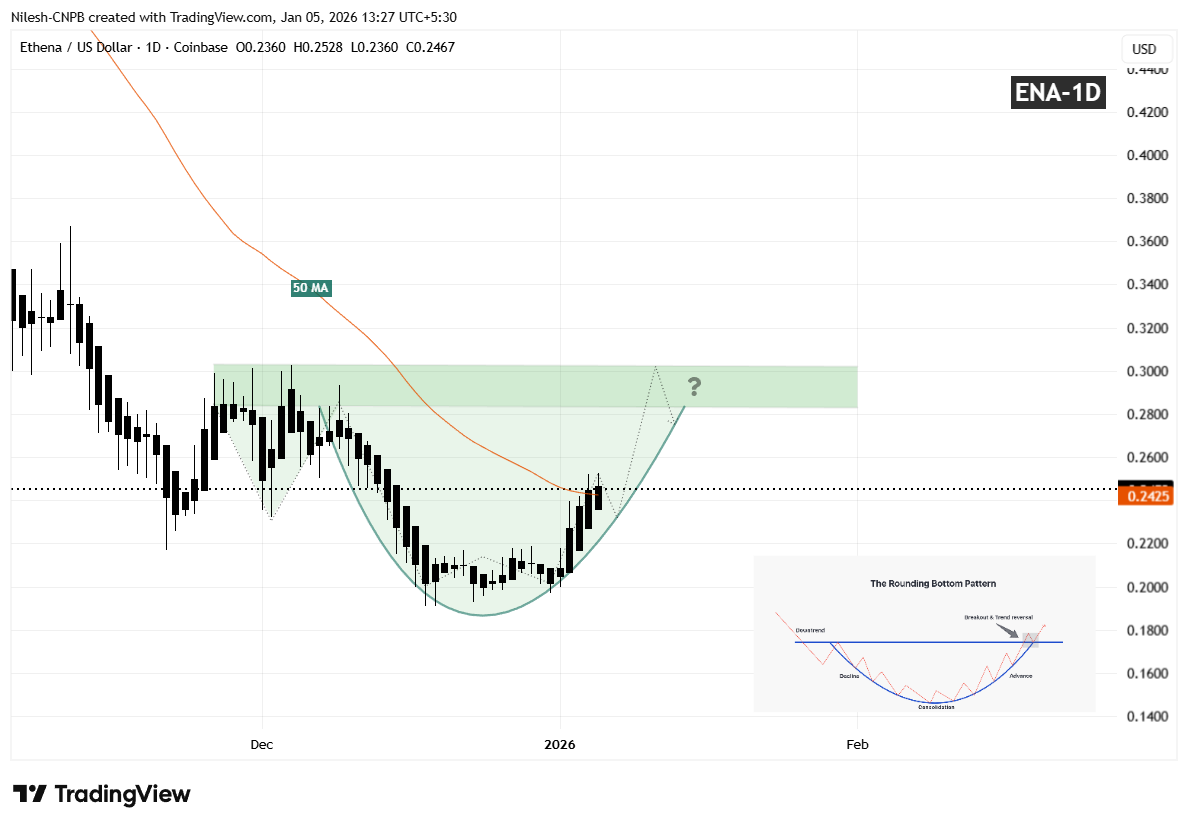
Ethena (ENA) Daily Chart/Coinsprobe (Source: Tradingview)
Since carving out that bottom, ENA has started to move higher in a smooth, rounded fashion, closely matching the textbook characteristics of a developing rounding bottom. The recent recovery has also brought price back toward the 50-day moving average near $0.2451, a level that previously acted as resistance and is now being tested as potential support.
What’s Next for ENA?
If ENA continues to hold above the 50-day MA, that level could act as a solid short-term base for further upside attempts. A clean and decisive breakout above the $0.3028–$0.2837 resistance zone, followed by sustained acceptance above it, would validate the entire reversal pattern and likely open the door for a broader bullish expansion phase.
Until such a breakout occurs, the pattern remains in development. Short-term consolidation or shallow pullbacks remain possible as price digests recent gains. However, as long as ENA continues to form higher lows above the established base, the broader bottoming structure remains intact and constructive.
For now, the chart suggests ENA is approaching a critical confirmation phase — one that could determine whether this recovery evolves into a sustained bullish trend as the new year unfolds.
Disclaimer: The views and analysis presented in this article are for informational purposes only and reflect the author’s perspective, not financial advice. Technical patterns and indicators discussed are subject to market volatility and may or may not yield the anticipated results. Investors are advised to exercise caution, conduct independent research, and make decisions aligned with their individual risk tolerance.
About Author: Nilesh Hembade is the Founder and Lead Author of Coinsprobe, with over 5 years of experience in the cryptocurrency and blockchain industry. Since launching Coinsprobe in 2023, he has been providing daily, research-driven insights through in-depth market analysis, on-chain data, and technical research.
Disclaimer: The information on this page may come from third parties and does not represent the views or opinions of Gate. The content displayed on this page is for reference only and does not constitute any financial, investment, or legal advice. Gate does not guarantee the accuracy or completeness of the information and shall not be liable for any losses arising from the use of this information. Virtual asset investments carry high risks and are subject to significant price volatility. You may lose all of your invested principal. Please fully understand the relevant risks and make prudent decisions based on your own financial situation and risk tolerance. For details, please refer to
Disclaimer.
Related Articles
CryptoQuant Alert: Bitcoin Bounce May Face Resistance Between 75,000 and 85,000 USD
CryptoQuant report shows bullish signals in the Bitcoin futures market, but if the price continues to rise, it will encounter resistance near $75,000 and $85,000. Meanwhile, the inflow of Bitcoin into centralized exchanges is accelerating, which may signal potential selling pressure, creating a contradiction with the bullish sentiment in the futures market.
MarketWhisper11m ago
Why Did Bitcoin Fall Today? Iran's Key Leader Dies, Hormuz Strait Faces Blockade Again
Recent reasons for Bitcoin's decline include geopolitical conflict uncertainty triggered by the death of Iranian wartime official Larijani, the blockade of the Strait of Hormuz pushing oil prices above $100, exacerbating inflation pressures and reducing Federal Reserve rate cut expectations, as well as institutional capital withdrawal. On the technical side, $72,000 is an important support level, and a break below could lead to further exploration toward $64,000.
MarketWhisper19m ago
Today's cryptocurrency fear and greed index fell to 26, with the market in a state of panic
Gate News Report: On March 18, Alternative.me data shows that today's cryptocurrency fear and greed index dropped to 26, with the market in a "panic state." Yesterday, the index was at 28, also in a "panic state."
GateNews40m ago
Market Awaits Fed Decision as Bitcoin Consolidates at $74,000 High
Middle East tensions remain elevated, with investors focusing on the impact of high oil prices on inflation and the Fed's interest rate decision. U.S. stocks rose slightly, with energy stocks performing well, while Bitcoin consolidated around thousand dollars. Markets expect the Fed to hold rates steady, with attention on Powell's remarks.
GateNews1h ago
CryptoQuant: BTC to Continue Rising or Face Resistance in the $75,000 to $85,000 Range
Before the Federal Reserve's imminent interest rate decision announcement, CryptoQuant analysis shows that derivatives market sentiment has turned bullish, with Bitcoin price potentially facing resistance between 75,000 and 85,000. Long positions have increased, funding rates have turned positive, but further upside should remain cautious of resistance levels.
GateNews1h ago
Here’s How Shiba Inu (SHIB) Price Could Explode 50%
Shiba Inu (SHIB) shows signs of potential recovery, pushing against a downward trendline. If it breaks through the $0.0000070 resistance, a 50% rally to $0.000010 is possible, indicating bullish momentum.
CaptainAltcoin3h ago
