ISM Manufacturing PMI hits 52.6, surpassing expectations and reaching a new high since August 2022, ending 26 months of contraction. Analysts note that historically, Bitcoin tends to rise after PMI reversals, but some question that last year, despite PMI remaining flat, Bitcoin still surged to $126,080. Institutional forecasts vary: Dragonfly sees $150,000, while Galaxy suggests $50,000 to $250,000 as possible.
PMI Breaks Above 50, Ending 26 Months of Contraction
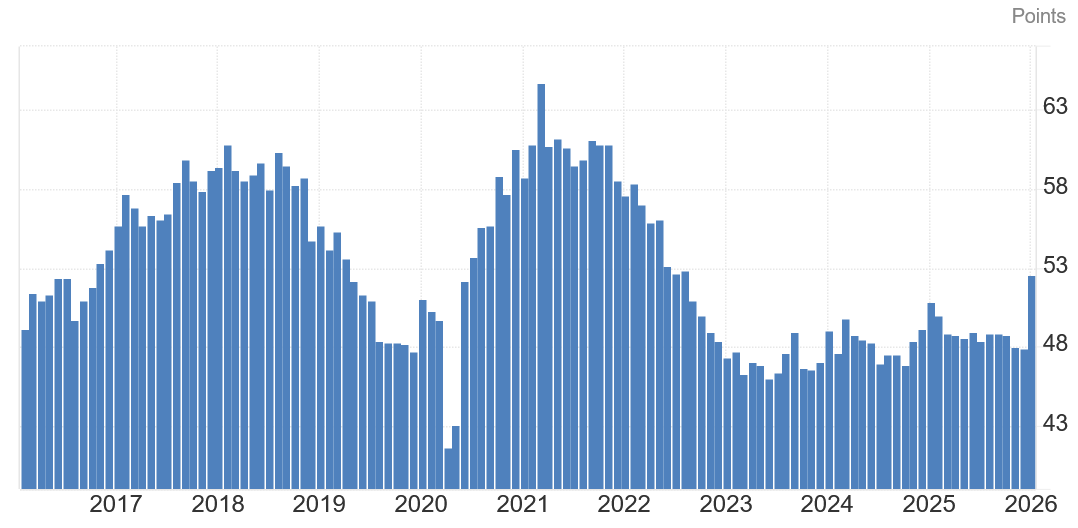
(Source: Trading Economics)
The U.S. Institute for Supply Management (ISM) released a report on Monday that shook the market. The Manufacturing Purchasing Managers’ Index (PMI) for January registered at 52.6, significantly exceeding the widely expected 48.5, ending 26 consecutive months of economic contraction. This figure not only broke the expansion/contraction threshold of 50 but also marked the highest monthly score since August 2022, indicating a strong recovery in U.S. manufacturing.
The PMI indicator is a key economic barometer closely watched by investors and the Federal Reserve, used to assess economic strength, inflation risks, and whether monetary policy needs tightening or easing. An ISM index above 50 indicates economic expansion, below 50 signals contraction. The 52.6 reading not only crosses the growth threshold but also shows robust expansion momentum, which is significant for risk asset markets.
The end of a 26-month contraction cycle finally marks a turning point, covering a period of aggressive Fed rate hikes, high inflation, and recession fears. The PMI reversal may signal that the U.S. economy has emerged from its toughest phase and is entering a new expansion cycle. Historically, such turning points are often associated with major shifts in risk assets, which is why Bitcoin analysts are rapidly focusing on this data.
Looking at the components, the rise in PMI reflects not just an improvement in a single indicator but a synchronized upturn in new orders, production, employment, and inventories. The increase in the new orders index is especially important as a leading indicator of future economic activity. When companies receive more orders, it suggests demand is recovering, which feeds into production expansion, job growth, and investment, creating a positive cycle.
Historical Data Reveals a Subtle Link Between PMI and Bitcoin
Joe Burnett, Vice President of Bitcoin Strategy at Strive, emphasizes the historical correlation between PMI and Bitcoin prices. He states, “Historically, these PMI reversals signal a shift toward risk appetite,” and notes that Bitcoin has risen following manufacturing output increases in 2013, 2016, and 2020.
The 2013 case is particularly classic. That year, PMI rebounded from a low at the end of 2012, and Bitcoin subsequently experienced two major rallies, soaring from $13 in early 2013 to $1,100 by year-end, an over 8,000% increase. Similarly, in 2016, after PMI bottomed out and rebounded, Bitcoin entered an epic bull run in 2017, skyrocketing from around $1,000 to $20,000. The 2020 case is even more direct, with a V-shaped PMI rebound after the pandemic, coinciding with Bitcoin’s rise from about $3,800 to a high of $60,000.
Three Logical Chains Linking PMI Rise to Bitcoin
Risk Appetite Increase: Manufacturing recovery boosts investor confidence, capital flows from safe assets to risk assets
Liquidity Environment Improvement: Economic expansion often accompanies loose monetary policy, abundant liquidity favors Bitcoin
Inflation Hedge Demand: Manufacturing expansion may trigger inflation fears, with Bitcoin serving as a hedge attracting funds
From mid-2020 to 2023, fluctuations in manufacturing indices closely correlated with Bitcoin and broader crypto market prices. This correlation is not coincidental but reflects systemic macroeconomic impacts on risk asset pricing. When manufacturing expands, corporate profits grow, employment improves, and consumer confidence rises, creating a favorable environment for risk investments. Bitcoin, as one of the most volatile risk assets, often gains excess returns in this environment.
A pseudonymous Bitcoin analyst, Plan C, further warns: “If you don’t quickly elevate your understanding of Bitcoin cycles from the four-year halving myth to macro/business cycle thinking… you will completely miss the second strong wave of Bitcoin bull market!” This challenges the long-held crypto community doctrine of “four-year halving cycles,” suggesting macroeconomic cycles are the main drivers of Bitcoin’s long-term trend.
Skeptical Voices: Decoupling of PMI and Bitcoin
However, not all analysts agree on a necessary link between PMI and Bitcoin. Benjamin Cowen, founder and CEO of Into The Cryptoverse, points out that Bitcoin’s movements are not always synchronized with manufacturing indices, adding “Bitcoin does not represent the economy.” His strongest evidence is the market performance in 2025.
Last year, despite several months of declining or flat ISM manufacturing PMI, indicating persistent weakness in manufacturing, Bitcoin soared. According to the PMI-Bitcoin positive correlation logic, Bitcoin should have been sluggish or declining. Instead, Bitcoin surged from around $40,000 at the start of 2025 to a peak of $126,080 in October, over 200% gains. This decoupling shows that Bitcoin’s price drivers are far more complex than a single macro indicator.
Cowen’s view represents an alternative analysis: Bitcoin’s price is mainly driven by crypto-native factors, including halving cycles, on-chain data, ETF capital flows, regulatory environment, and technological innovation. While macro factors influence, they are not decisive. The strong performance in 2025 is mainly attributed to the launch of spot ETFs, crypto-friendly policies under the Trump administration, and institutional adoption acceleration, rather than PMI trends.
This divergence highlights the complexity of the Bitcoin market. As an emerging asset class, Bitcoin is influenced by traditional macro factors but also has unique supply-demand dynamics. Sometimes it behaves like a risk asset, moving in tandem with tech stocks and manufacturing data; at other times, it exhibits independence, driven solely by crypto-native narratives. Investors need to monitor both macro indicators and on-chain data to form a comprehensive view.
Deep Reasons Behind Institutional Forecast Divergence
Since the liquidation event on October 10, Bitcoin has experienced turbulent months, with over $19 billion in leveraged crypto positions suddenly liquidated. Currently, Bitcoin’s price has fallen nearly 38% from its October high, while precious metals and equities mostly trend upward, dampening market sentiment. Institutional investors’ outlooks for Bitcoin in 2026 are extremely divided.
In their 2026 forecast reports, crypto venture firm Dragonfly predicts Bitcoin will trade above $150,000 by year-end. Fundstrat’s Tom Lee forecasted on January 20 that Bitcoin will dip further before rebounding to new highs. The most extreme is Galaxy Digital, which refuses to give specific predictions, stating 2026 is “too chaotic” to estimate, with a final price range of $50,000 to $250,000.
This $50,000 to $250,000 range, a fivefold difference, reflects the current market’s uncertainty. Bullish factors include: historic PMI rebound, continued ETF adoption, crypto-friendly policies under Trump, and supply tightening post-halving. Bearish factors include: macro liquidity tension, geopolitical risks, high correlation with traditional risk assets, and technical bearish structures.
Related Articles
Supported by ETF fund inflows, Bitcoin shows "strong" rebound near $72,800
Under the influence of capital inflows into U.S. spot cryptocurrency ETFs, Bitcoin prices stabilized last week and touched a high of 73,927 USD, with gains of approximately 6% to 7%. Ethereum also rebounded, indicating a recovery in market risk appetite. ETF capital inflows became the main support factor. Despite volatility in macroeconomic market sentiment, reassuring commentary on inflation and oil price risks helped stabilize prices.
区块客10m ago
Bitcoin Breaks Through $74,000 Resistance Level, Crypto Market Strengthens Collectively, ETH and SOL Lead Weekly Gains
On March 16, the crypto market continued to rise, with Bitcoin surpassing $74,000, up 2.9% in 24 hours. Ethereum and Solana showed larger gains, indicating capital flowing toward higher-risk crypto assets. An improving macroeconomic environment provided market support, with falling oil prices and a weakening dollar aiding liquidity release. The market is focused on the upcoming Federal Reserve meeting, which could impact future interest rate expectations.
GateNews18m ago
Bitcoin Breaks Above 50-Day Moving Average Approaching $74,000, BTC Upward Momentum Strengthens But $75,000 May Become Key Resistance Level
Bitcoin's price surged over 3% on March 16, reclaiming the 50-day moving average and breaking through $71,125, indicating strengthened market momentum. Despite external uncertainties, Bitcoin demonstrated resilience and gradually recovered above the $70,000 level. Analysts noted that stabilization above the 50-day moving average may signal a trend reversal, but technical breakthroughs don't necessarily guarantee long-term gains. The market is watching whether Bitcoin can break through $75,000, with trading volume and capital inflows being key factors.
GateNews23m ago
Bitcoin Breaks Through $73,000! Outperforms Gold Amid US-Iran War, EF Sells 10.2 Million ETH
Bitcoin recently broke through $73,000 with strong performance, decoupling from tech stocks and gold. Analysts predict that if the market stabilizes, it could rise to $75,000 to $80,000. However, geopolitical risks and extremely fearful market sentiment continue to pressure prices. Meanwhile, the Ethereum Foundation sold Ether for approximately $10.2 million to maintain operations.
CryptoCity1h ago
On-chain activity is exploding, but Ethereum can't seem to gain momentum? Experts reveal the "fatal weakness": could drop to $1,500
CryptoQuant's latest report indicates that Ethereum is facing an "adoption paradox," where network activity reaches new highs, but the token price continues to decline. Analysts predict that if the bear market persists, Ether could fall to $1,500. Despite thriving on-chain activity, it has decoupled from the token price, and the high proportion of Ether flowing into exchanges suggests heavy selling pressure and weak investment demand.
区块客1h ago
Bitcoin Breaks Through $74,000! 24-Hour Surge of 3.68%, ETFs Continue to Attract Capital, Multiple Factors Provide Support
Bitcoin broke through $74,000 on March 16th, with a gain of 3.68%, primarily driven by ETF capital inflows, halving supply effects, and geopolitical safe-haven demand. While market sentiment remains optimistic, short-term volatility is intensifying, and investors should carefully manage risk and monitor future support levels and selling pressure.
動區BlockTempo1h ago